
The JIT is not switched on in any default installation. For the test suite I measured this on, that is the right setting for one of its two modes of operation: with opcache.jit=function a test run takes 5.8 % longer than with no JIT at all, with opcache.jit=tracing a good quarter less. The same compiler, the same test suite, and the difference lies entirely in when it decides what to compile.
A just-in-time compiler (JIT) is the second translation. The compiler does the first one before the script runs: source code becomes opcodes, and OPcache keeps them around. The JIT translates those opcodes on into machine code, while the script is already running. Its own run time therefore comes straight out of the response time somebody is waiting on, and it has to earn that back. Whether it manages to depends on how long the compiled code keeps running afterwards.
The first of the two articles before this one, which were about the executor and about the optimiser, ended with one sentence about the JIT that I did not want to leave standing on its own. So I kept reading. Everything that follows refers to PHP 8.6.
What the interpreter cannot avoid
Dispatch is the hot spot of an interpreter, but it is not the work. The work sits in the handlers, and there the same thing happens on every pass.
Take this function:
<?php declare(strict_types=1);
function sum(int $n): int
{
    $result = 0;

    for ($i = 0; $i < $n; $i++) {
        $result += $i;
    }

    return $result;
}
The handler for ADD looks at its two operands, finds that both are integers, adds them, checks for overflow and writes the result back together with its type tag. On the thousandth pass it knows exactly as much as it did on the first. It cannot know anything: it is one C function, called for every occurrence of ADD in every script.
Then there is where the values live. A PHP variable is a zval: sixteen bytes, eight for the value and eight for type information and bookkeeping. $result and $i sit in the call frame, which means in memory. Every addition loads both, checks both types, computes and writes back.
What a JIT saves is not the jumping, but the finding out over and over again. Once it is established that this loop always adds two integers, the addition is a single machine instruction on two registers, and all the rest falls away.
How it comes by that knowledge is where the two modes of operation part company.
The JIT is just another handler
The article about the executor was about the handler field in zend_op: the place that says how an instruction is to be executed. Depending on the dispatch model that is a function pointer, a number, or a jump address.
The JIT uses the same field. At the end of compilation, ext/opcache/jit/zend_jit_ir.c contains this assignment:
if (jit->op_array) {
    /* Only for function JIT */
    const zend_op_array *op_array = jit->op_array;
    zend_op *opline = (zend_op*)op_array->opcodes;

    if (!(op_array->fn_flags & ZEND_ACC_HAS_TYPE_HINTS)) {
        while (opline->opcode == ZEND_RECV) {
            opline++;
        }
    }
    opline->handler = (zend_vm_opcode_handler_t)entry;
entry is the address of the machine code the JIT has just produced. It goes into the field the dispatch code reads the handler from. To the executor, compiled code is therefore indistinguishable from a handler: it jumps there like it jumps to any other one.
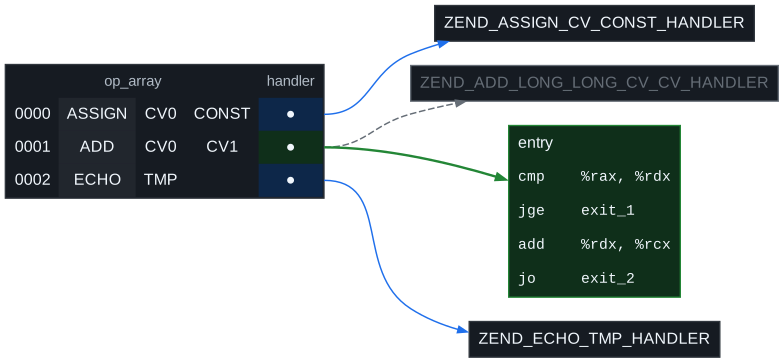
This is why the JIT does not replace the executor. It attaches itself to individual instructions and takes over from there for as long as things go well. Everything that is not compiled keeps running through the dispatch loop.
That close coupling has a consequence the article about the executor already hinted at. OPcache checks at startup whether the executor is still its own:
if (zend_execute_ex != execute_ex) {
    if (zend_dtrace_enabled) {
        zend_error(E_WARNING, "JIT is incompatible with DTrace. JIT disabled.");
    } else if (strcmp(sapi_module.name, "phpdbg") != 0) {
        zend_error(E_WARNING, "JIT is incompatible with third party extensions that override zend_execute_ex(). JIT disabled.");
    }
    JIT_G(enabled) = 0;
    JIT_G(on) = 0;
    return FAILURE;
}
zend_execute_ex is the function pointer through which the engine enters the executor. Xdebug replaces it so that it gets control on every function call: there is no other way to record a stack trace or to stop at a breakpoint. Once that has happened the JIT switches itself off, before it has compiled anything at all. JIT and Xdebug are not mutually exclusive because somebody decided so, but because the JIT jumps straight into handlers that would no longer run.
The JIT is off
The sentence at the top can be checked:
$ php -r 'var_dump(ini_get("opcache.jit"), ini_get("opcache.jit_buffer_size"));'
string(7) "disable"
string(3) "64M"
Up to PHP 8.3 the setting was tracing and the buffer was 0, which amounted to the same thing but was considerably more confusing. Since PHP 8.4 it is the other way round: the buffer is there, the JIT is off. Neither php.ini-production nor php.ini-development mentions opcache.jit at all. Anyone who wants the JIT has to put the setting into their php.ini themselves.
There are two modes of operation, and the same switch selects them:
$ php -d opcache.enable=1 -d opcache.enable_cli=1 -d opcache.jit=tracing \
      -r 'print_r(opcache_get_status()["jit"]);'
Array
(
    [enabled] => 1
    [on] => 1
    [kind] => 5
    [opt_level] => 4
    [opt_flags] => 6
    [buffer_size] => 67108848
    [buffer_free] => 67107035
)
opcache.jit also accepts a four-digit number in which each digit configures one aspect, from left to right: whether AVX instructions may be used, register allocation, trigger, and optimisation level. tracing is shorthand for 1254, function for 1205. Turning the digits individually is something for debugging the JIT itself; for everything else the two words are enough.
Function JIT: compile everything before anything runs
The function JIT is triggered when a script is loaded, and it compiles every function in it completely. Whether the function is ever called makes no difference.
Its only source of information is the type inference the optimiser performs anyway. It converts the function into static single assignment form, SSA for short, and derives from that which types a variable can have at a given point. In sum(int $n), $n is an integer, that is in the signature. $i starts at 0 and is only ever incremented. $result starts at 0 as well, but $result + $i can overflow, and then it is a float.
Whatever the inference cannot rule out has to be checked at run time, and both branches have to be present in the generated code. This is the loop that comes out of it:
.next:
mov    %rcx,0x60(%r14)       ; write $result back into the call frame
.inc:
lea    0x1(%rax),%rax        ; $i++
cmpb   $0x0,0x20e79be        ; EG(vm_interrupt)
jne    .interrupt
mov    0x50(%r14),%rcx       ; load $n from the call frame
cmp    %rax,%rcx
jle    .done
mov    %rcx,0x50(%r14)
movl   $0x4,0x58(%r14)
cmpb   $0x4,0x68(%r14)       ; is $result an int?
jne    .slow_path
mov    %rax,%rcx
add    0x60(%r14),%rcx       ; $result + $i, the addend comes from memory
jno    .next
vxorps %xmm0,%xmm0,%xmm0     ; overflow: the float path, inline
vcvtsi2sdq 0x60(%r14),%xmm0,%xmm0
vxorps %xmm1,%xmm1,%xmm1
vcvtsi2sd %rax,%xmm1,%xmm1
vaddsd %xmm0,%xmm1,%xmm0
vmovsd %xmm0,0x60(%r14)
movl   $0x5,0x68(%r14)       ; set the type of $result to IS_DOUBLE
jmp    .inc
%r14 holds the pointer to the call frame, the numbers in front of it are offsets into it. $result is written back to memory on every iteration and $n is loaded afresh on every iteration. The type of $result is checked again on every iteration. And the float path for the overflow sits in the middle of the loop, six SSE instructions that almost never execute.
The code is correct for every case that can occur, and it pays for that with memory accesses and type checks on every iteration.
Tracing JIT: watch first, then compile
The tracing JIT reverses the order. It compiles nothing until it has seen what actually happens.
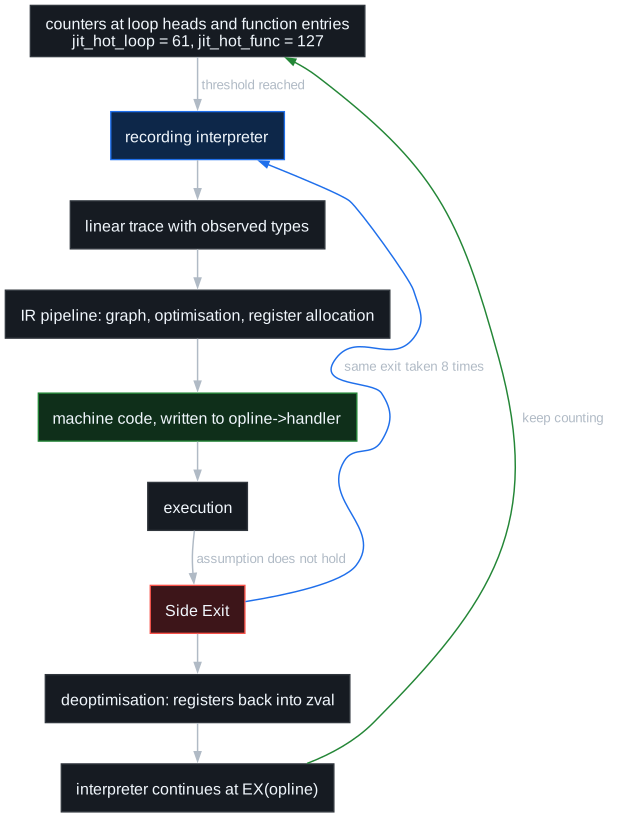
To do that it puts counters where repetition is likely: at loop headers and at function entries. The counter is a handler again, one that calls the original handler as long as it has not fired yet:
ZEND_OPCODE_HANDLER_RET ZEND_OPCODE_HANDLER_CCONV zend_jit_func_counter_helper(ZEND_OPCODE_HANDLER_ARGS)
{
    zend_jit_op_array_hot_extension *jit_extension =
        (zend_jit_op_array_hot_extension*)ZEND_FUNC_INFO(&EX(func)->op_array);

    *(jit_extension->counter) -= ((ZEND_JIT_COUNTER_INIT + JIT_G(hot_func) - 1) / JIT_G(hot_func));

    if (UNEXPECTED(*(jit_extension->counter) <= 0)) {
        *(jit_extension->counter) = ZEND_JIT_COUNTER_INIT;
        zend_jit_hot_func(execute_data, opline);
        ZEND_OPCODE_RETURN();
    } else {
        zend_vm_opcode_handler_t handler = (zend_vm_opcode_handler_t)jit_extension->orig_handlers[opline - EX(func)->op_array.opcodes];
        ZEND_OPCODE_TAIL_CALL(handler);
    }
}
zend_jit_hot_counters is an array of 128 counters for the whole program, and which one a function gets is decided by a hash over the address of its opcode array. Different functions therefore share counters and heat each other up. For the purpose that is good enough: no accurate count is needed here, only a hint that enough is going on.
The thresholds are opcache.jit_hot_loop (61), opcache.jit_hot_func (127) and opcache.jit_hot_return (8). When a counter runs out, a second executor takes over: a recording interpreter. It calls the same handlers as always, but writes down which instructions were actually executed and which types the operands had.
What comes out of that is a straight line through the code. No branches, no loop structure, only the instructions in the order in which they ran this time. And because function boundaries mean nothing to the recording interpreter, the recording runs straight through calls.
For this loop:
function square(int $x): int { return $x * $x; }

for ($i = 0; $i < $n; $i++) { $s += square($i); }
the tracer records the following:
0009 T3 = IS_SMALLER CV2($i) CV0($n) ; op1(int) op2(int)
0010 ;JMPNZ T3 0004
0004 INIT_FCALL 1 112 string("square")
     >init square
0005 SEND_VAR CV2($i) 1 ; op1(int)
0006 T3 = DO_UCALL
     >enter square
0000  CV0($x) = RECV 1
0001  T1 = MUL CV0($x) CV0($x) ; op1(int) op2(int)
0002  VERIFY_RETURN_TYPE T1 ; op1(int)
0003  RETURN T1 ; op1(int)
     <back run
0007 CV1($s) = ADD CV1($s) T3 ; op1(int) op2(int)
0008 PRE_INC CV2($i) ; op1(int)
The call has turned into an indentation. The observed types sit as a comment behind each instruction, and they are what the compiled code is built from.
A recording ends for one of 28 reasons, listed as a macro in zend_jit_internal.h:
#define ZEND_JIT_TRACE_STOP(_) \
    _(LOOP,              "loop") \
    _(RECURSIVE_CALL,    "recursive call") \
    _(RECURSIVE_RET,     "recursive return") \
    _(RETURN,            "return") \
    _(LINK,              "link to another trace") \
    _(INTERPRETER,       "exit to VM interpreter") \
    /* ... */ \
    _(NOT_SUPPORTED,     "not supported instructions") \
    _(EXCEPTION,         "exception") \
    _(TOO_LONG,          "trace too long") \
    _(TOO_DEEP,          "trace too deep") \
    _(LOOP_UNROLL,       "loop unroll limit reached") \
    _(LOOP_EXIT,         "exit from loop") \
    _(BLACK_LIST,        "trace blacklisted") \
    _(INNER_LOOP,        "inner loop")
The first ones are successes: the loop came back round to its start, the function returned, the trace runs into another trace. The later ones are aborts. Only three opcodes cannot be recorded at all, namely CATCH, FAST_CALL and FAST_RET, the instructions through which catch and finally are entered.
Every assumption costs an exit
This is where the JIT pays for its advantage. A compiler that translates before the program starts may only assume what it can prove from the source code; that is how C, Go and Rust work. The JIT may assume what it has observed, and it pays for that by having to guard every one of those assumptions at run time.
A recorded trace records what happened once. About the next pass it says nothing. So every assumption becomes a check, and every check needs a way out.
These ways out are called side exits, and OPcache lists them on request. For the loop in sum() there are four:
---- TRACE 1 exit info
     exit_0: 0006/0000/1 CV0($n):int
     exit_1: 0008/0001/3 CV0($n):int(rax:1) CV1($result):int(rcx) CV2($i):int(rdx)
     exit_2: 0004/0004/3 CV0($n):int(rax:1) CV1($result):int(rcx) CV2($i):int(rdx)
     exit_3: 0006/0007/3/VM CV0($n):int(rax:1) CV1($result):int(rsi) CV2($i):int(rdx)
The first checks a type before the loop starts. The second is the end of the loop, the third the overflow in the addition, the fourth an interruption by the engine. Behind every exit it says which variables are still live there and which register holds them.
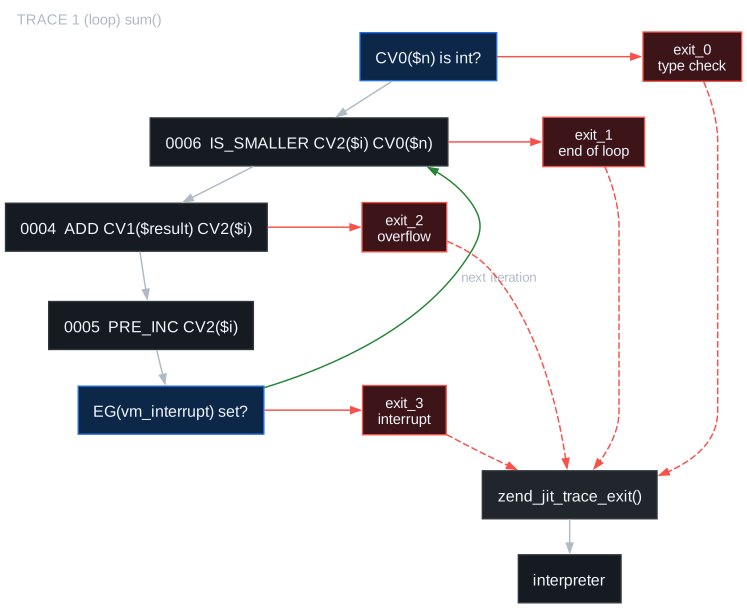
How many guards a trace needs depends on how much is already established. Remove the type declaration from sum(int $n) and the same loop looks like this:
---- TRACE 1 exit info
     exit_0: 0006/----/0
     exit_1: 0006/0000/1 CV0($n):int
     exit_2: 0006/0001/2 CV0($n):int CV1($result):int
     exit_3: 0008/0003/3 CV0($n):int(rax:1) CV1($result):int(rcx) CV2($i):int(rdx)
     exit_4: 0004/0006/3 CV0($n):int(rax:1) CV1($result):int(rcx) CV2($i):int(rdx)
     exit_5: 0006/0009/3/VM CV0($n):int(rax:1) CV1($result):int(rsi) CV2($i):int(rdx)
Four exits become six, and 78 bytes of machine code become 100. The extra checks sit in front of the loop rather than inside it, so the difference in run time is small here. I still find it interesting that you can watch a type declaration arrive in the machine code.
The interpreter takes over at every exit
In compiled code the values sit in registers, and they sit there without a type tag, because the type was established. The interpreter, however, expects zval structures in the call frame. Somebody has to translate between the two worlds.
zend_jit_trace_exit() does that. A stub first saves all registers into a buffer. Then the function walks the slots of the call frame and writes each value back as a proper zval, guided by a map laid down at compile time:
} else if (STACK_REG(stack, i) != ZREG_NONE) {
    if (STACK_TYPE(stack, i) == IS_LONG) {
        zend_long val = regs->gpr[STACK_REG(stack, i)];
        ZVAL_LONG(EX_VAR_NUM(i), val);
    } else if (STACK_TYPE(stack, i) == IS_DOUBLE) {
        double val = regs->fpr[STACK_REG(stack, i) - ZREG_FIRST_FPR];
        ZVAL_DOUBLE(EX_VAR_NUM(i), val);
    } else {
        ZEND_UNREACHABLE();
    }
}
A value can come from a register, from a spill slot on the stack, from a constant, or from nothing but a type with no value at all. At the end EX(opline) is set to the instruction execution should resume at, and the interpreter carries on there as if nothing had happened. This translation back is called deoptimisation, and it is the contract between JIT and executor: at every exit the interpreter has to be able to take over.
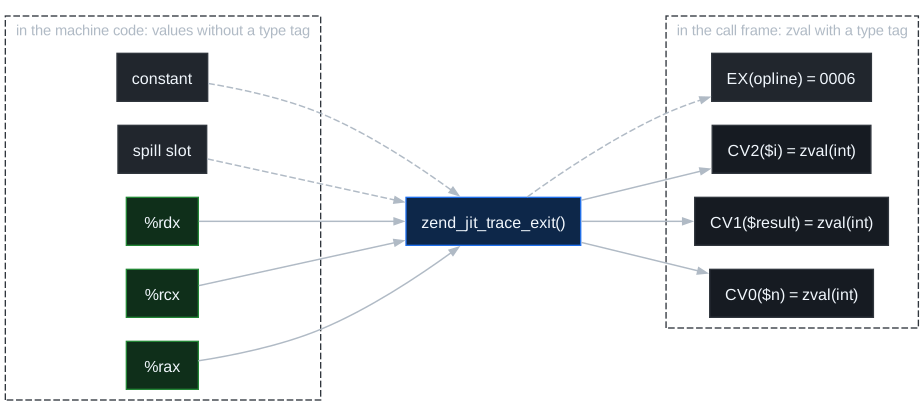
zval structures in the call frame and an instruction to carry on at.
When the same exit is taken often, the assumption behind it was too narrow. After eight failures, configurable via opcache.jit_hot_side_exit, the JIT records a new trace starting from there. This output comes from a loop over an array that first holds only integers and later floats as well:
---- TRACE 1 start (loop) work() sidetrace.php:6
---- TRACE 1 stop (loop)
---- TRACE 1 compiled

     TRACE 1 exit 0 work() sidetrace.php:6
     TRACE 1 exit 0 work() sidetrace.php:6
     ... six more times ...
---- TRACE 3 start (side trace 1/0) work() sidetrace.php:6
---- TRACE 3 stop (link to 1)
---- TRACE 3 compiled
Trace 1 covers integers. Trace 3 is the latecomer for floats, and it links back to trace 1 once it is done. Over time a web of traces grows that covers the cases which actually occur, rather than every conceivable one.

A compiler that cannot take its time
Between the recorded trace and the machine code sits a complete optimising compiler. Since PHP 8.4 that is no longer PHP's own code: underneath sits the IR framework by Dmitry Stogov, IR for intermediate representation, which lives checked in under ext/opcache/jit/ir/ and is periodically pulled in from the upstream project. Roughly 47,600 lines belong to the framework, roughly 37,100 to the PHP-specific part that translates opcodes into its representation.
That representation is a sea of nodes: a graph in which data dependencies and control dependencies are the same thing, namely edges between nodes. There are no separate basic blocks that instructions are stuck to; an addition floats freely until it is settled where it sits most cheaply. The same idea is behind HotSpot and V8.
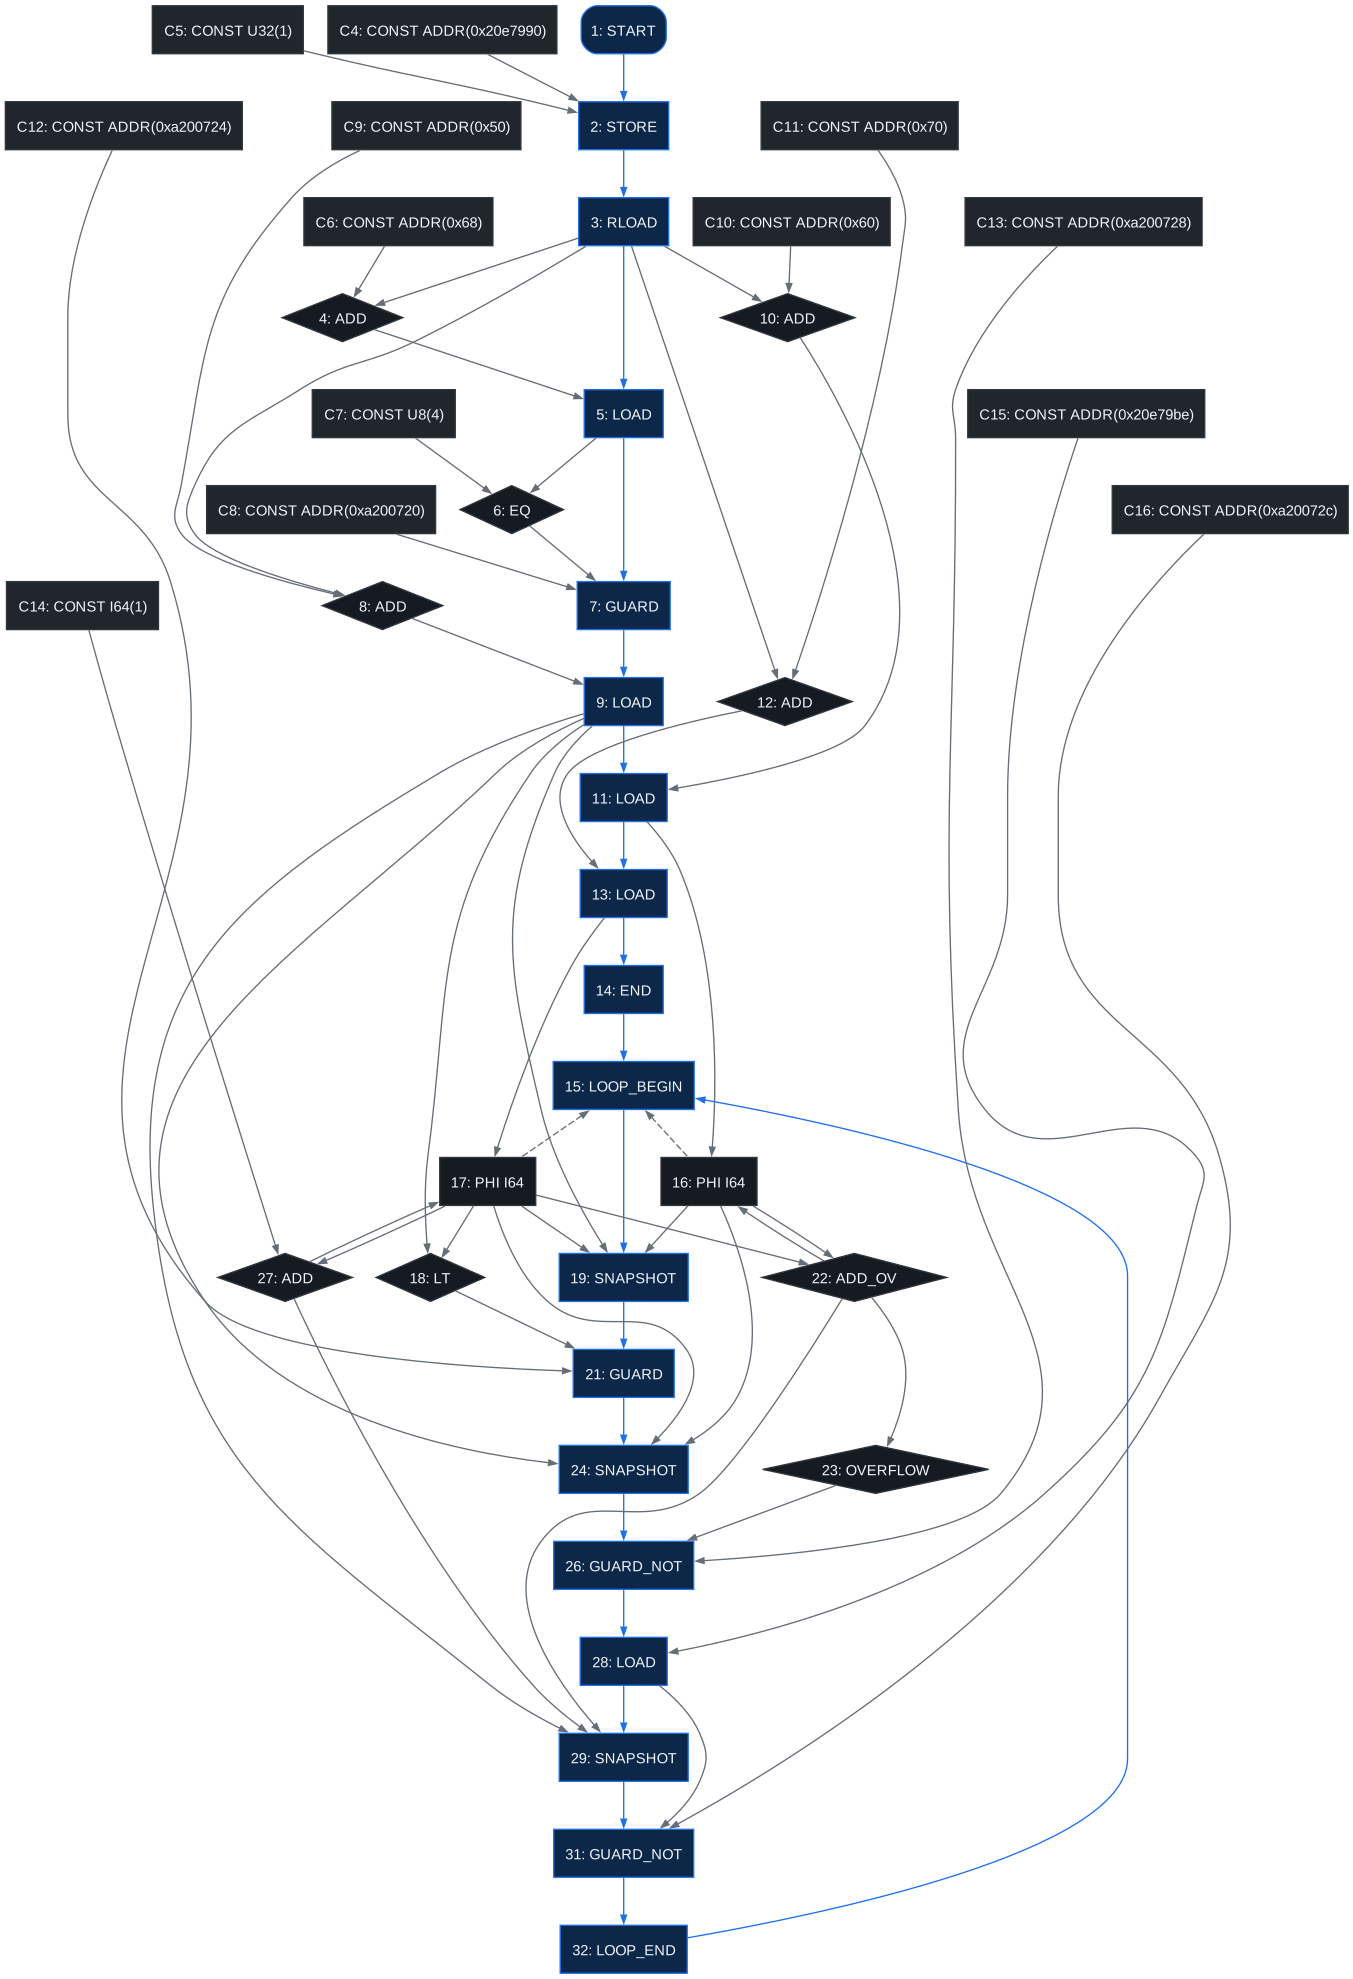
opcache.jit_debug prints for this loop: control and data dependencies are both edges between nodes. Blue is the control flow, grey the data flow, and the exits hang off the checks as addresses.
The actual pipeline runs on top of that representation:
ir_build_def_use_lists(ctx);
ir_sccp(ctx);

ir_build_cfg(ctx);
ir_build_dominators_tree(ctx);
ir_find_loops(ctx);

ir_gcm(ctx);
ir_schedule(ctx);

ir_match(ctx);
ir_assign_virtual_registers(ctx);
ir_compute_live_ranges(ctx);
ir_coalesce(ctx);
ir_reg_alloc(ctx);

ir_schedule_blocks(ctx);

entry = ir_emit_code(ctx, size);
That is all of it. Constant folding already happens while the graph is being built, then one round of constant propagation, then the control flow graph is built and every floating node is pinned to its best place, then instruction selection, then linear scan register allocation, then code emission. For comparison: GCC and LLVM run dozens of passes over the code.
The brevity is deliberate, and the framework itself gives the numbers for it: the code it produces is on average about 5 % slower than what gcc -O2 produces, but it is produced around forty times faster. For a compiler that runs while somebody is waiting for the answer, that is the right trade.
I like the contrast with the executor. The executor is generated from templates by a PHP script, once, before PHP is built, and it can take as long as it likes. The JIT generates code during the request and has to justify every millisecond. Both are code generators, and the constraints lead to completely different designs.
One loop, nine instructions
The starting point is sum() from above again. The recorded trace is the loop, linearised:
0006 T3 = IS_SMALLER CV2($i) CV0($n) ; op1(int) op2(int)
0007 ;JMPNZ T3 0004
0004 CV1($result) = ADD CV1($result) CV2($i) ; op1(int) op2(int)
0005 PRE_INC CV2($i) ; op1(int)
Four instructions, all operands observed as integers. Out of that come 78 bytes of machine code:
movl   $0x1,0x20e7990        ; EG(jit_trace_num) = 1
cmpb   $0x4,0x68(%r14)       ; is $result an int?
jne    .exit_0
mov    0x50(%r14),%rax       ; $n
mov    0x60(%r14),%rcx       ; $result
mov    0x70(%r14),%rdx       ; $i
.loop:
cmp    %rax,%rdx
jge    .exit_1                ; $i >= $n, the loop is over
mov    %rdx,%rsi
add    %rcx,%rsi             ; $result + $i
jo     .exit_2                ; the result no longer fits into an int
lea    0x1(%rdx),%rdx        ; $i++
cmpb   $0x0,0x20e79be        ; EG(vm_interrupt)
jne    .exit_3
mov    %rsi,%rcx             ; the new $result
jmp    .loop
I gave the jump targets names; in the original there are addresses there. Otherwise this is what the JIT produced.
At the top the entry: one type check, then $n, $result and $i are fetched from the call frame into registers, once. After that, nine instructions of loop body in which no memory access occurs at all. Compare, add, increment, three jumps for the three things that can go wrong, and back to the start.
The two absolute addresses are engine variables. 0x20e7990 is EG(jit_trace_num), where the trace writes its own number so that deoptimisation knows later which trace it came from. 0x20e79be is EG(vm_interrupt), the flag through which signals, timeouts and the garbage collector interrupt execution. Compiled code has to look at it too; otherwise a JIT-compiled loop could no longer be aborted.
For anyone who wants to look at this themselves: every piece of output in this article comes from opcache.jit_debug. The value is a bit mask, and it has to be given in decimal. -d opcache.jit_debug=0x1000 is silently read as 0 and prints nothing at all, which looks exactly like nothing having been compiled. Useful values are 4096 for trace starts, 16384 for successful compilations, 262144 for the recorded bytecode and 1048576 for the exit list. The assembly needs a PHP built with --with-capstone.
And now real code
Nine instructions for a loop is a nice result, but sum() is not software either. So I looked at the same thing in the raytracer from the last article: final readonly classes with float properties. Plenty of arithmetic, but wrapped in objects and method calls. The link points at exactly the revision I analysed and measured.
The innermost loop of the matrix multiplication looks like this:
<?php declare(strict_types=1);
for ($i = 0; $i < $size; $i++) {
    for ($k = 0; $k < $size; $k++) {
        for ($j = 0; $j < $size; $j++) {
            $result[$i][$k] += $this->elements[$i][$j] * $that->element($j, $k);
        }
    }
}
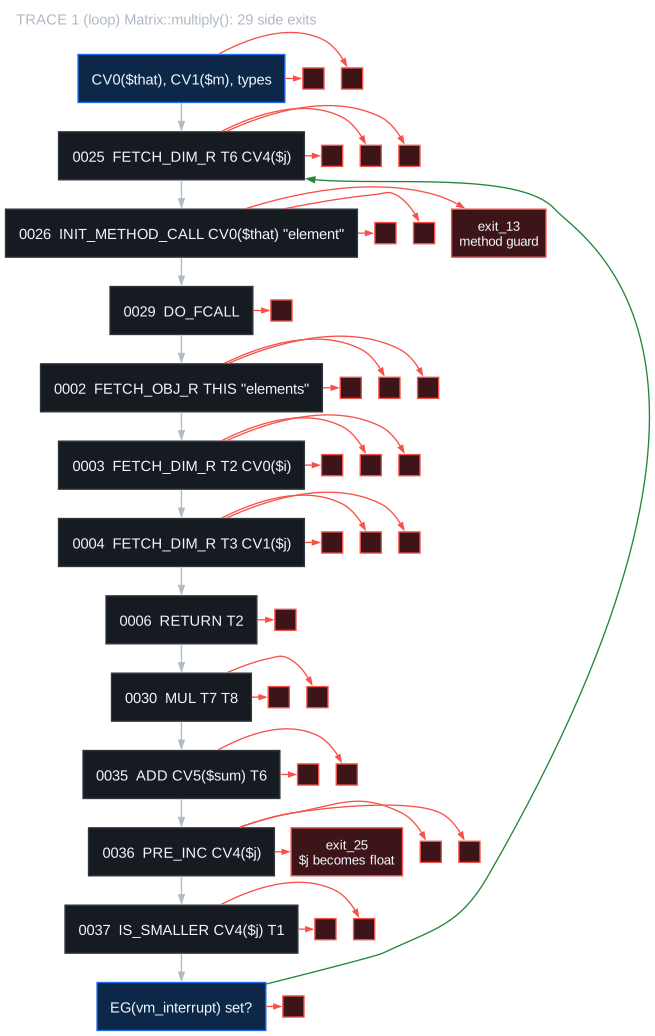
The tracer pulls the method call in, as expected:
0025 T7 = FETCH_DIM_R T6 CV4($j) ; op1(packed array) op2(int) val(float)
0026 INIT_METHOD_CALL 2 CV0($that) string("element")
     >init SebastianBergmann\Raytracer\Matrix::element
0029 T8 = DO_FCALL
     >enter SebastianBergmann\Raytracer\Matrix::element
0002  T2 = FETCH_OBJ_R THIS string("elements") ; val(array)
0003  T3 = FETCH_DIM_R T2 CV0($i) ; op1(packed array) op2(int) val(array)
0004  T2 = FETCH_DIM_R T3 CV1($j) ; op1(packed array) op2(int) val(float)
0006  RETURN T2 ; op1(float)
     <back SebastianBergmann\Raytracer\Matrix::multiply
0030 T6 = MUL T7 T8 ; op1(float) op2(float)
A method on another object of the same class, resolved and laid out flat inside the trace. That is the kind of optimisation an interpreter fundamentally cannot offer.
The price for that is in the exit list. This one trace has 29 exits. Every array access can meet a different kind of array and every property access a different class; on top of that, every calculation can overflow. Two of the exits stand for the rest:
exit_13: 0026/0088/8/POLY(rax, rdi) ... X6:array X7:float
exit_25: 0035/0145/9 ... CV4($j):float(9.22337e+18) ...
The first is a guard on the method call: the JIT remembered which method $that->element resolved to and checks on every pass whether it is still the same one. The second is the exit for the case where $j++ leaves the integer range and turns into a float.
Four exits have become 29, and 78 bytes of machine code have become 1,457. Same mechanism, same procedure, but in object-oriented PHP there is a check hanging off nearly every step. It still pays: this multiplication runs a good two and a half times faster with the tracing JIT than without it.
What this does for a test suite
This raytracer's test suite has 177 tests and takes a good nine seconds without the JIT, most of it in floating point arithmetic. If a JIT helps anywhere, it helps here.
I measured the wall clock time of the whole process, including startup, bootstrap and compilation. That is the number you see while you wait. opcache.jit_buffer_size was set to 64M throughout, the value the output above shows.
| Run | no JIT | tracing | function |
|---|---|---|---|
| bootstrap only, no test | 0.34 s | 0.44 s | 3.57 s |
| one run | 9.16 s | 6.48 s | 9.69 s |
--repeat 3
|
27.08 s | 22.15 s | 21.75 s |
--repeat 10
|
88.25 s | 56.78 s | 66.68 s |
The row that surprised me is the first one. A run that executes not a single test, because the filter matches nothing, takes three and a half seconds with the function JIT. That is pure compilation time for code that is never executed afterwards.
The second row is where that comes back out. A single test run takes 9.69 s with the function JIT against 9.16 s with no JIT at all, so 5.8 % longer. That is not much, and it took fifteen runs per configuration before I was sure it was not noise.
--repeat makes PHPUnit run each test several times in the same process, and that separates the fixed cost cleanly from the cost per repetition. Fitting a line through the three measurements gives this:
| Mode | Fixed cost | Per repetition | Factor |
|---|---|---|---|
| no JIT | 0.34 s | 8.77 s | 1.00 |
| tracing | 0.44 s | 5.42 s | 1.62 |
| function | 3.57 s | 6.35 s | 1.38 |
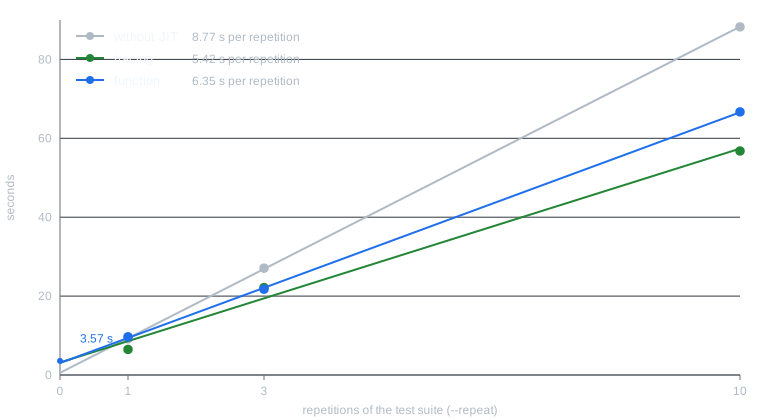
The function JIT only earns its three and a half seconds back from the second repetition onwards. The tracing JIT has both the smaller intercept and the smaller slope; it is ahead from the first run and stays ahead. Its code is also better in the long run, because it can specialise on observed types rather than on proven ones.
The difference can be put in bytes as well. After a full test run the tracing JIT has produced around 0.86 MB of machine code, the function JIT around 22.7 MB. That is twenty-six times as many bytes for a worse result.
What the tracing JIT compiles in this test suite at all shows up in a separate run with the debug output switched on. It starts 1,184 recordings and takes 908 of them all the way to machine code. The four reasons a recording starts contribute very differently to that:
| Reason | started | compiled |
|---|---|---|
return, where a call has returned
|
438 | 356 |
enter, on entering a function
|
312 | 298 |
loop, at a loop header
|
233 | 64 |
side trace, at an exit of another trace
|
201 | 190 |
Loops are not only the minority here, they are also the only reason for which a recording mostly fails: of 233 loop traces started, 64 make it, while for the other three it is more than 80 %. What the JIT compiles in a test suite therefore mostly begins where a call has just returned or a function is being entered. That is the difference between application code and a benchmark that counts one number up a million times, and it is one reason why published JIT numbers vary so widely.
When this pays off
When the time goes into PHP code that computes, the JIT is worth a factor. When the time goes into the database, the file system or the network, it is worth nothing, and no setting changes that. So before the question of which JIT mode makes any sense, it has to be clear where the time goes.
Once that is established, tracing is the right choice for everything I measured. It has hardly any fixed cost and it also produces the better code. The function JIT compiles everything up front, which puts it at a structural disadvantage on the command line, because its fixed cost is paid again on every invocation.
Except that I measured all of it on the command line, and that is precisely the case the function JIT is bad at. Under FPM its fixed cost is paid once per worker and then spreads across every request that worker still serves. A worker that pushes ten thousand requests through the same classes is the case the function JIT is built for. I have not measured that, and I would therefore not carry the recommendation above over to FPM: there the code runs long enough for the arithmetic to turn around.
And when you compare numbers between two PHP installations, opcache.jit belongs in the comparison, the way ZEND_VM_KIND and opcache.optimization_level already did in the two articles before. In my measurements the difference between the two modes is larger than the difference between two PHP versions.
What I took away
What stayed with me most is the guard count. Four exits for an integer loop, 29 for one line out of a real project. Those two numbers say more about what a JIT can do for which code than any percentage from a benchmark.
Switching the JIT on is a bet that the code runs long enough to earn the compilation back. In a long-running process that bet usually pays off. In a short command line invocation the interpreter that has been optimised for twenty years wins often enough. That a test suite is one of the cases where the function JIT loses that bet is something I would not have expected.